What is possible with the TerraIndex geoserver in QGIS?
What is possible with the TerraIndex geoserver in QGIS?
Some video's and demo's on our YouTube channel;
Short demo video;
https://www.youtube.com/watch?v=tajDDZf7Ths
(Dutch) Inhoudelijke sessie in het webinar:
https://youtu.be/oBfX5rZLnf8?t=3579
A Quick overview
Show pinned projects on the map:
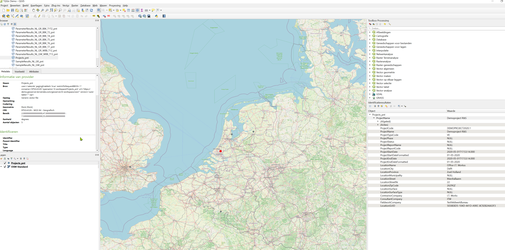
Show measurement objects with custom icons on the map:
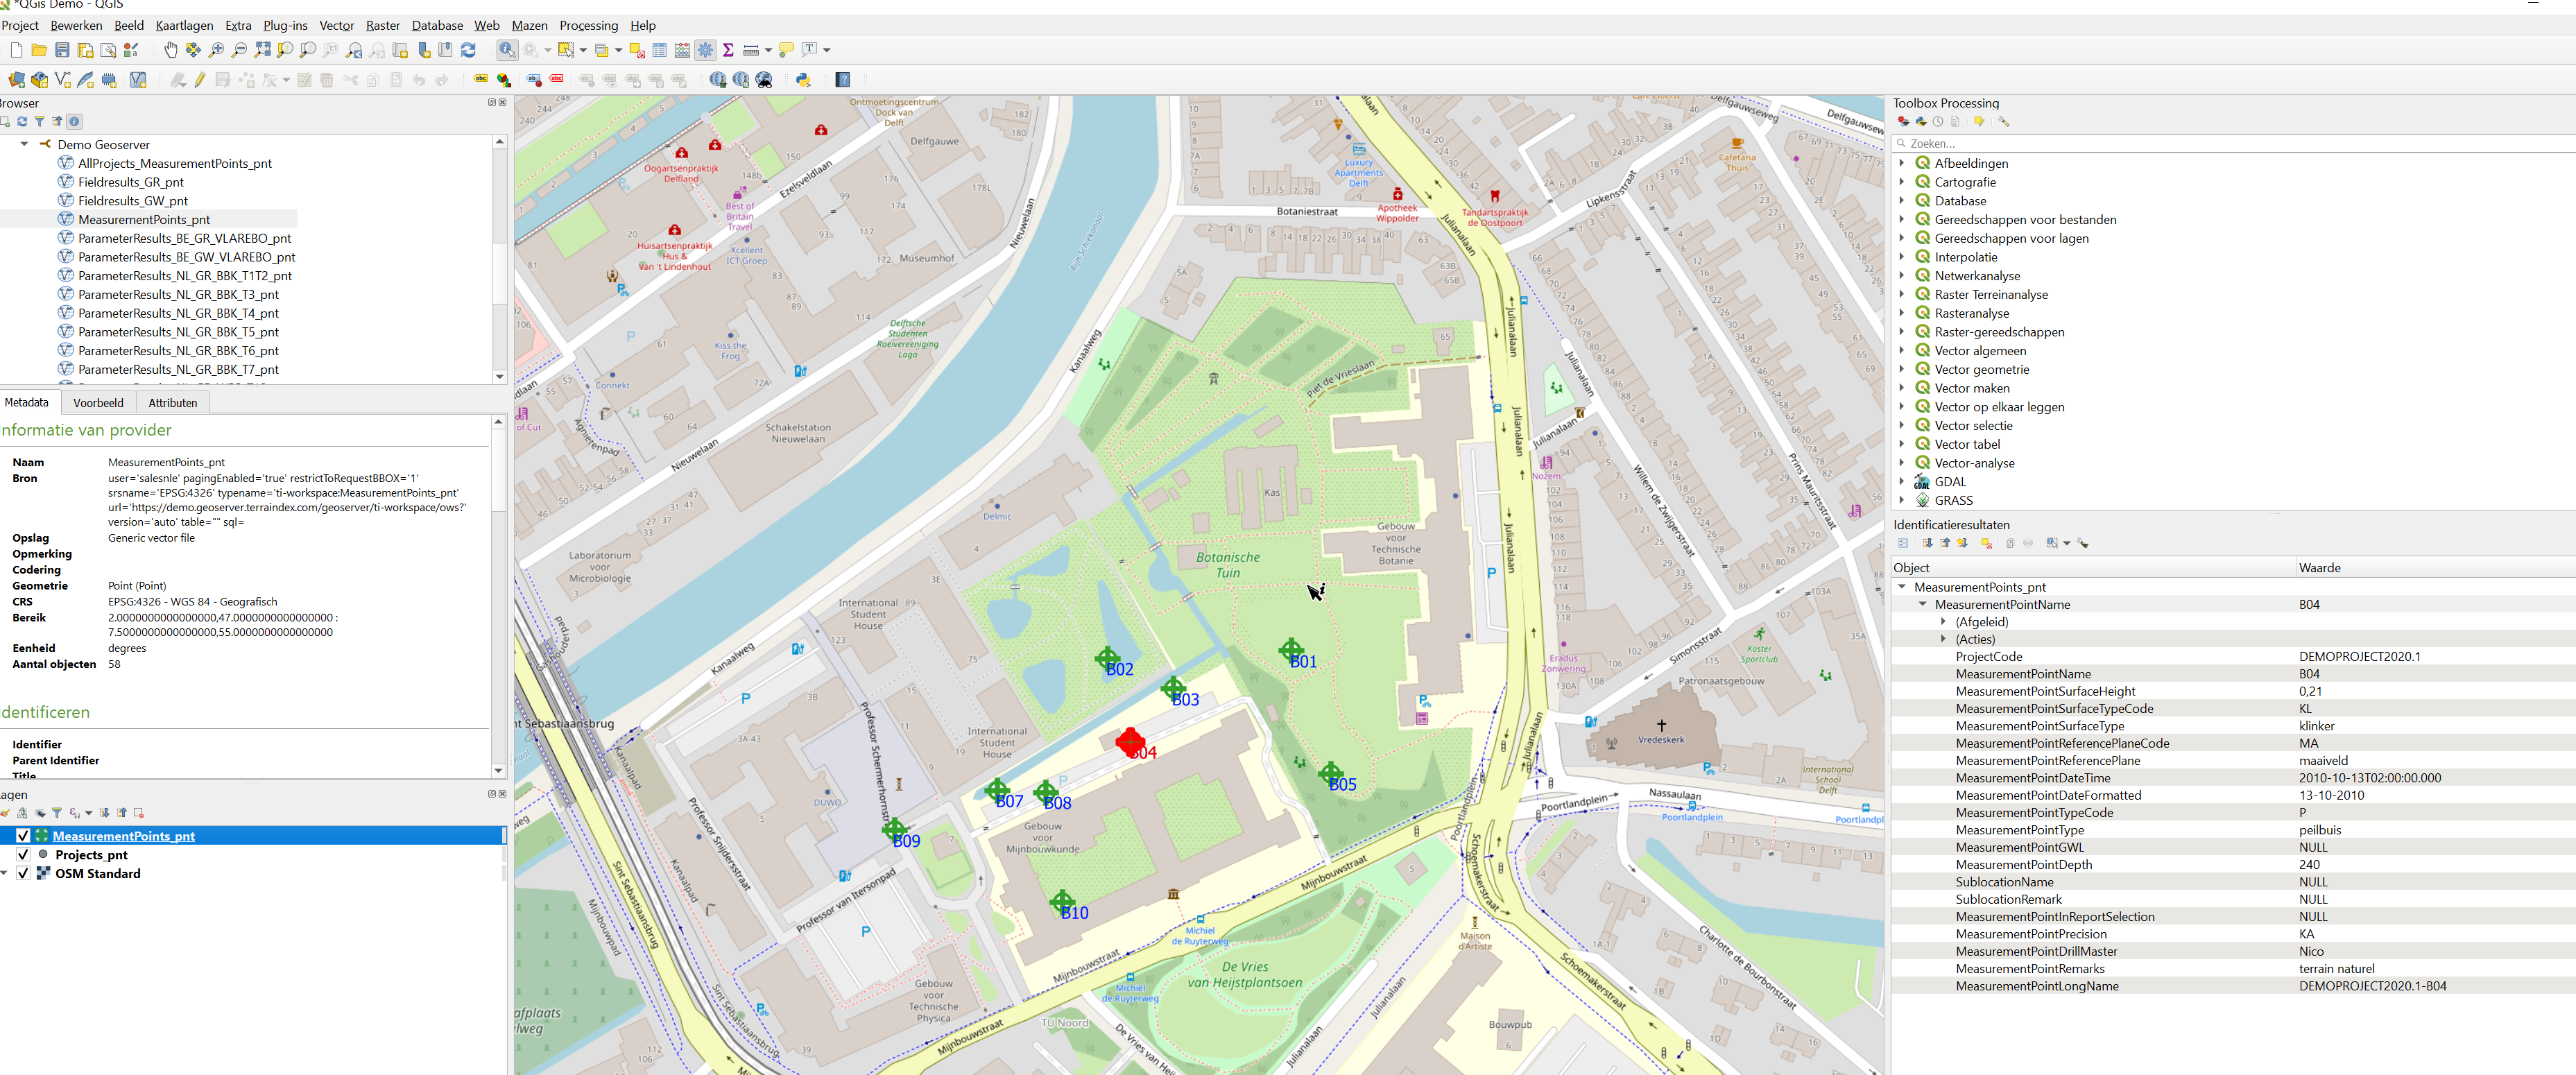
Filter and show measurement objects:
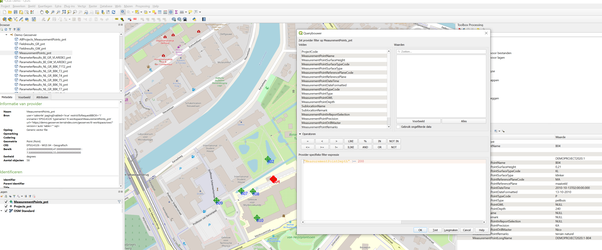
Show lab and or assessment results with your measurement points, make contours and be able to filter / search within those results
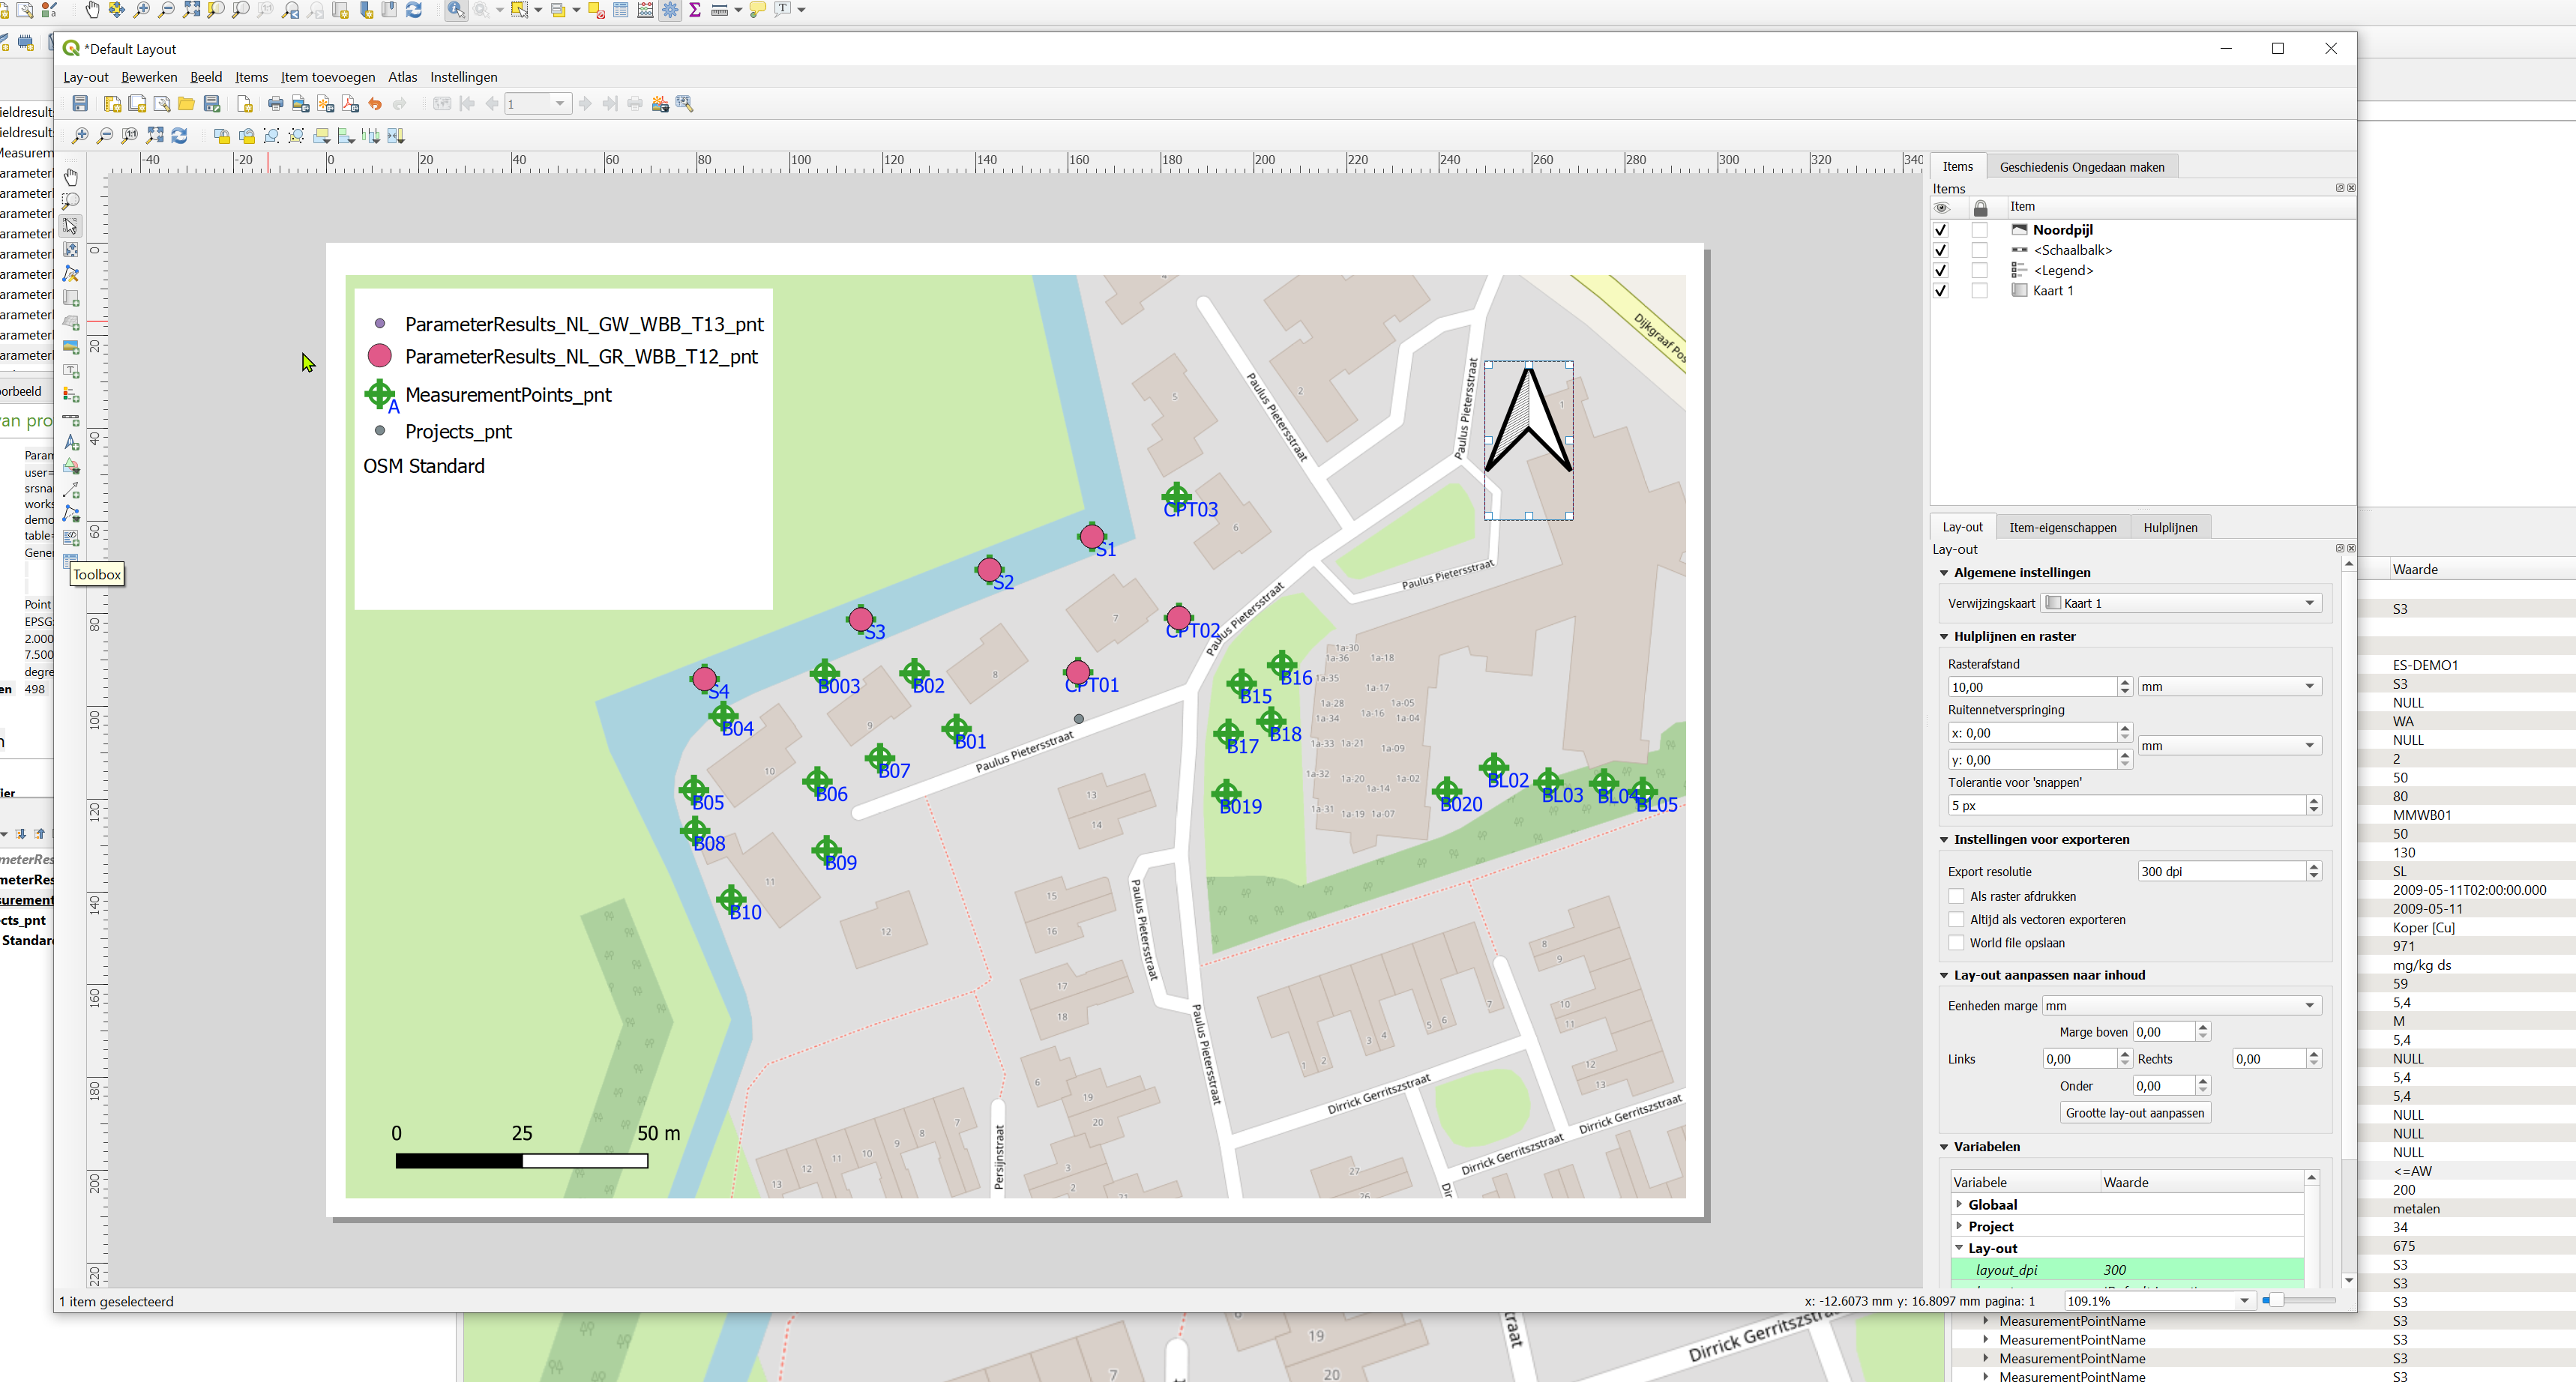
With a print template it's easy to design a borehole map in your own templates:
These layers are availlable in the Geoserver:
| Dataset: | All Projects_MeasurementPoints_pnt | |
| Goal: | Show all projects of the company, with all measurement objects (20K limit), so the user can find his projects on the map. Usefull for finding projects that have been done in the past. | |
| Details | Must be clickable to request the data of the project that a user can see on the map. ProjectCode, projectname and Projectguid need to be visible. Alternatively, you can Pin the project to your account in TerraIndex to check the details. | |
| Dataset: | Projects_pnt | |||
| Goal: | Show which projects are pinned so a cuser can use it to find his projects on the map. Useful to get a quick and easy oversight of your own projects. Possible to filter with options such as 'Client' or "Startdate / Enddate" | |||
| Feedback: |
| |||
| Dataset: | MeasurementPoints_pnt | |||
| Goal: | Showing the different kind of measurement objects on the map so it's clear which type of measurement objects have been done at the location. Can create a map with labels and height afterwards for example. | |||
| Feedback: |
| coredrill is is not yet a type (used for asalt / concrete cores) | ||
| Dataset: | SampleResults_GR_NL_pnt | |||
| Goal: | Showing of the assessment results of the samples per analysis sample, so the quality of the soil can be shown on top of the measurement objects. Must be filtered on sample conclusion, depth and assessment result Assessment samples of BBK (T1, T2, T3, T4, T5, T6 en T7) + WBB (T12) | |||
| Dataset: | SampleResults_NL_GW_pnt | |||
| Goal: |
| |||
| Dataset: | ParameterResults_NL_GR_WBB_T12_pnt | |||
| Goal: | Per subsample all parameters will all results must be showed so you can see per invidival compound what the pollution is at a specific measurement point. You can filter by depth, parameter and testresult. This way you can search for a specific testresult of a specific parameter. | |||
| Dataset: | ParameterResults_NL_GW_WBB_T13_pnt | |||
| Goal: | All parameters with results must be shown per water sample so that per parameter you can see what the exceedance is in the groundwater at the location of a measuring point. There must be filtered at depth, parameter and testresult. As a label you could use parameter with measured value and / or testresult. By giving the parameters per soil tube you can see in the depth where the pollution is. | |||
| Dataset: | ParameterResults_NL_GR_BBK_T1T2_pnt | |||
| Goal: | All parameters with results must be shown per sub-sample so that per parameter can be shown what the exceedance is at the location of a measuring point. There must be a filter for depth, parameter and testresult. As a label you could use parameter with measured value and / or judgment. By giving the substances per sub-sample, you can clearly indicate at which measuring points exceeds testresults for lead for example. | |||
| Dataset: | ParameterResults_NL_GR_BBK_T[3-7]_pnt | TESTSUBFRAMEWORKID: T3 = 21, T4 = 22, T5 = 23, T6 = 24, T7 = 25 | ||
| Goal: | All parameters with results must be shown per sub-sample so that per parameter can be shown what the exceedance is at the location of a measuring point. There must be filtered at depth, parameter and testresult. As a label you could use parameter with measured value and / or testresult. By giving the substances per sub-sample, you can clearly indicate at which measuring points exceeds the test from, for example, lead. | |||
| Dataset: | eigen normen_how_pnt | ONTBREEKT NOG | ||
| - | dataset missing, no showing of testresults (like lowest maximum values) per measurement object possible | |||
| - | setup and fields of dataset "wbb_grond_how_pnt" but with own assessments | |||
| - | field "date", just date (no datetime combination) | |||
| - | field with "projectcode" | |||
| - | Fields "mvhoogte", "refvlak" (To calculate the depth relative to the reference point) | |||
| Dataset: | testresults_eigen normen | ONTBREEKT NOG | ||
| - | dataset missing, no showing of testresults (like lowest maximum values) per measurement object possible | |||
| - | setup and fields of dataset "testresults_wbb_grond" but with own assessments | |||
| - | field "date", just date (no datetime combination) | |||
| - | field with "projectcode" | |||
| - | Fields "mvhoogte", "refvlak" (To calculate the depth relative to the reference point) | |||
| Dataset: | Fieldresults_GW_pnt | |||
| Goal: | Showing watersamples on the map, with other visual oberservations. | |||
| Dataset: | Fieldresults_GR_pnt | |||
| Goal: | Exchanging depths on the map of, for example, clay layers and other visual observations. | |||
| Dataset: | ParameterResults_BE_GR_VLAREBO_pnt | |||
| Goal: | All parameters with results must be shown per sub-sample so that per parameter can be shown what the exceedance is at the location of a measuring point. There must be a filter for depth, parameter and testresult. As a label you could use parameter with measured value and / or judgment. By giving the substances per sub-sample, you can clearly indicate at which measuring points exceeds testresults for lead for example. | |||
| Dataset: | ParameterResults_BE_GW_VLAREBO_pnt | |||
| Goal: | All parameters with results must be shown per water sample so that per parameter you can see what the exceedance is in the groundwater at the location of a measuring point. There must be filtered at depth, parameter and testresult. As a label you could use parameter with measured value and / or testresult. By giving the parameters per soil tube you can see in the depth where the pollution is. | |||
| Dataset: | Brussel GR | ONTBREEKT NOG | ||
| Dataset: | Waalse GR | ONTBREEKT NOG | ||
| Dataset: | Vlarebo Grondverzet | ONTBREEKT NOG | ||
| Dataset: | Project locatie | ONTBREEKT NOG ** HH Delfland zou dit willen met de baggervak lijnen | ||